The Pick 3 Number Game

ThGreetings Pick 3 Players,
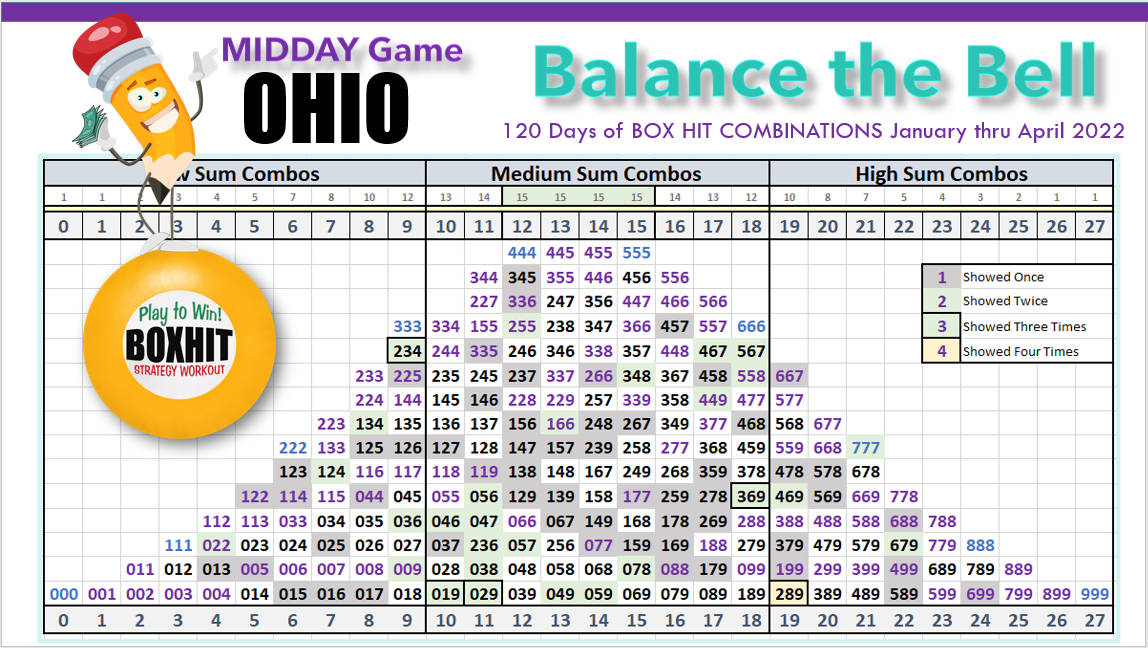
Gambling should always be fun and not detrimental to your pocket. A seasoned gambler will have a budget that they stick with ---else you will always lose more than you will win. The fact is the game and its prizes in comparison to it costs to wager has been designed so that the house wins. If you can except that, and play the game within its own confines and aim for BOX HITS, instead of straight payouts you will have more fun playing this game; and you can expect to win more often. The Truth about the Pick 3 Draw Quit thinking that there are 1000 combinations possible to draw. There are only 220 3-digit number combinations for the Pick 3 Draw game. And by paying strict attention to JUST the 220 Unique Single and Double Number Combinations that can be born from 000 to 999. If you watch the draws unfold, they do form a pattern I designed to offer you trends and wage on the game when its ready to flip. More on my Box Hit play is coming. It's a lot easier to get a BOX HIT than it is to hit a straight. Yes, they pay more but they are still harder to catch unless you back them up with more money. DO A EXAMPLE OF THE MONEY SPENT Aiming for box hits is financially more reasonable to me. It allows you to cover a wider range of number combinations, and play more often within a smaller budget. Gambling should always be fun and not detrimental to your pocket. A seasoned gambler will have a budget that they stick with ---else you will always lose more than you will win. The fact is the game and its prizes in comparison to it costs to wager has been designed so that the house wins. If you can except that, and play the game within its own confines, aiming for BOX HITS, instead of STRAIGHT PAY OUTS you will have more fun playing and can put their money in your pocket. My budget a week for playing the Pick 3 game is $10. And I don't play everyday, I watch, wait and then wager. Letting my $10 budget roll into the next week at times because I watch the game trend and waiting for a flip. More on the flip later. I'll be sharing below how I personally look at the Pick 3 Game using Ohio as my example. I live in Ohio, so I play the Ohio games. I've learned the hard way that it helps to know how your State's draw results are trending. Trends that can offer you the gamblers edge in your wagering play. I am going to discuss those trends that get me a Box Hit at least once or twice a month later in this writing. But first, Lets talk about those 220 unique number combinations and Balancing the Bell. Balancing the Bell is fun way to pick combinations to play and its a visual system that you can start right now. Balance the BellYou can get started Balancing the Bell for your States game by downloading for FREE the 220 Unique Single and Double Number Combinations worksheet below. (see chart below). I've arranged these combinations by their Sums. You Balance the Bell by checking off draw combinations as they result over time so you can visually see what combinations have yet to be drawn. Every possible 1000 pick 3 combinations are in this grid below but concentrated into their Unique Single and Double Combination.
You can download a Printable PDF file for your personal use in your State of play for FREE at my GumRoad store.
|
Ohio's Stats on 220 Unique Number CombinationsI took a look at both Ohio's Midday and Evening game draw results over the last 13 years. I found that there was an average of 52 numbers combinations within the 220 unique combinations that were not drawn in a period of a year. Take a good look at the image below and recognize its value to you as someone who wages on the Pick 3 game in Ohio or any other State.
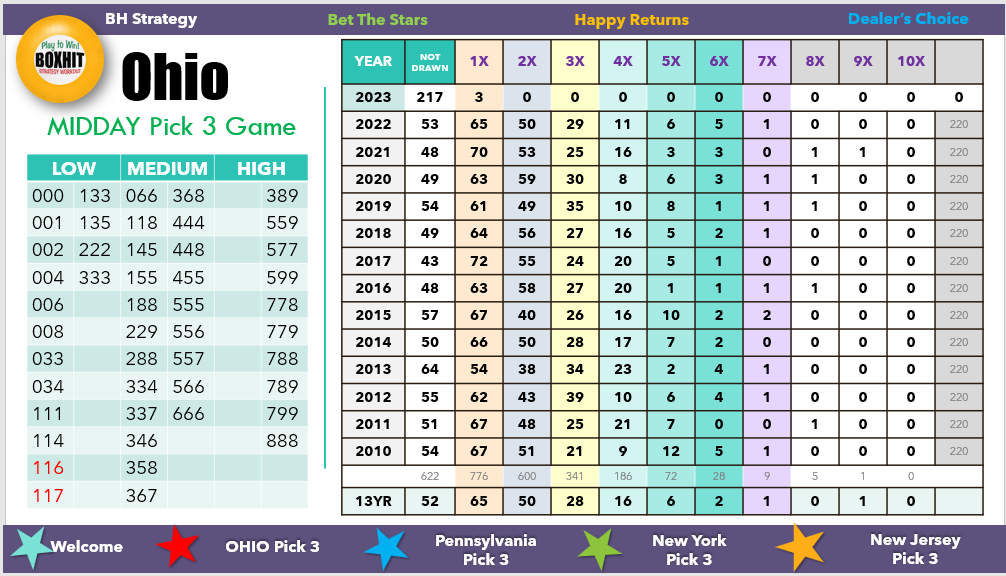
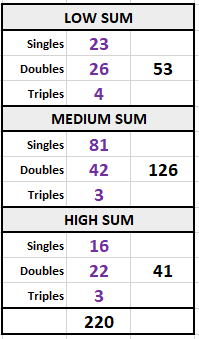
In the image above, I included a list of the 53 numbers that were not drawn during the year 2022 for the Midday game. However, this month of January 2023 two of those numbers have been drawn. So it's a good thing to learn what numbers have yet to been drawn in a years time and play them when you see the game is trending in one of their directions by considering low, medium and high Sums along with Repeating numbers.
Over a thirteen year period 65 combinations came in at least once. 50 Combinations came in on average, Twice. This means, if you start tracking draws from the beginning of the year, you can begin to consider that numbers that have come in once thus far, are likely to come in again. But when? Well, that is where watching the game unfold over time and recording the results helps you sight trends.
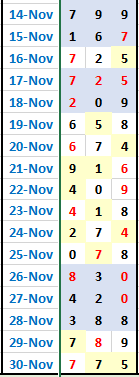
For instance, in 2022 in the Midday Game, a repeating number from one draw to the next was likely to happen 15 times a month on average. That is valuable information for the serious Pick 3 player. For an example using Ohio's 2022 Evening game, on the 14th of November no number repeated from what was drawn for the Evening Game on the 13th. The numbers are in my recording are kept black. But, On the 15th thru to the 17th the number 7 repeated for 4 games drawn in a row. Then the game flipped to repeat the number 2. The on the 19th the game flipped again to no repeating number. Then the next game picked up a repeating 6 for two draws. Then on the 22nd the game flips and picks up a repeating 9. When you watch your State's game unfold over time and color code their events you begin seeing the patterns emerge that become useful to predict future events. You earn an intuitive intelligence on the beat of the game and will often predict correctly at least one of numbers drawn. But you have to earn that insight by recording the draws of the game. We will discuss the colors Blue and yellow later. For now, Let's get back to the averages the number combinations keep while they unfold year to year and understand that you can also look at all the combinations that came in for a second itme, and consider that they will come in for a third time during the course of the year. My chart shows you that there are an average of 28 combinations that will show up for a third time in a years time. And an average of 16 times for a fourth time. This past year I hit two box hits in December because I knew that there was a good chance for combinations that came in for fouth time had a high probability to come in for a fifth time.
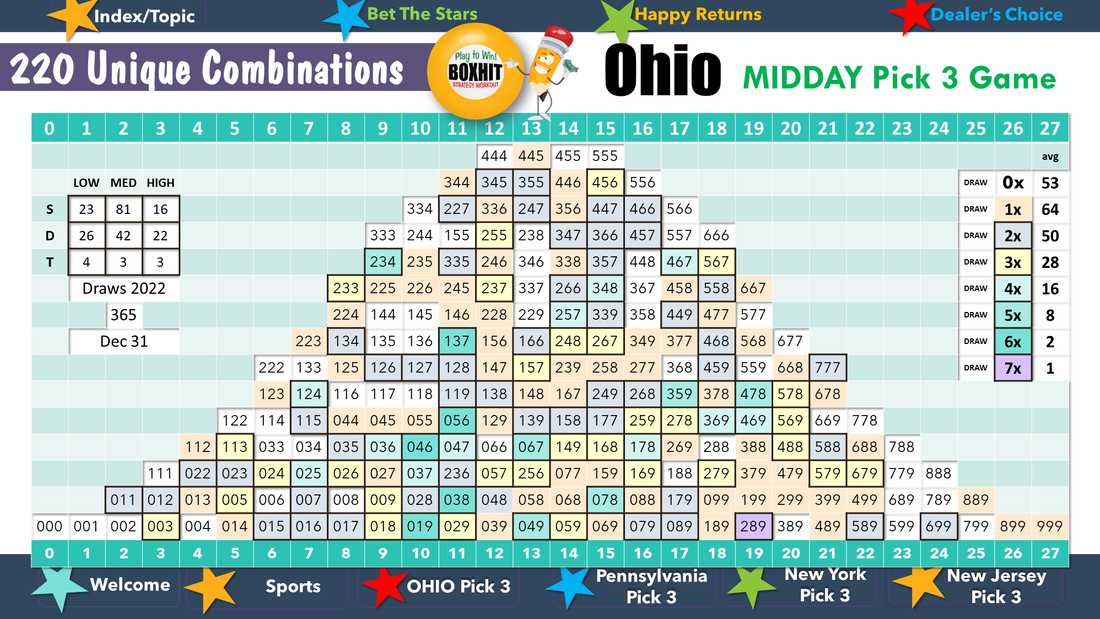
For the purpose of this writing I used the 220 Combination Bell that I made to check off the combinations that were drawn in the Midday Game from the start of January 2022 through to December 2022 to illustrate one way of looking at Pick 3 draw game. I've color coding them as they reached draws of a second, third, fourth, fifth, sixth and seventh time; and by doing this I now have my eye on the 238 combination, not only because it hasn't show up in 2022, but because it is a medium sum of 13 and medium sums show up the most often because there is more of them, 126 to be exact. This is one way to play the Pick 3 game by equipping yourself with accumulating hindsight into combinations drawn. Color coding and Balancing the Bell is just one way to have fun watching your States' game draw results and getting in on the play with some small wagering for a BOX HIT, or even a STRAIGHT HIT if you are so inclined to make that wager. Recording and Analyzing TrendsNow lets talk about the colors Blue and Yellow you saw earlier. I designed myself a MSExcel worksheet to record Ohio's Pick 3 draw results side-by-side using some splashed in colors of Blue and Yellow to put draws into a specific catagory that also have their drawing averages that help me make better waged bets.
I designing a worksheet to visually see the days draw results side by side for the month ahead and at a glance, I can see
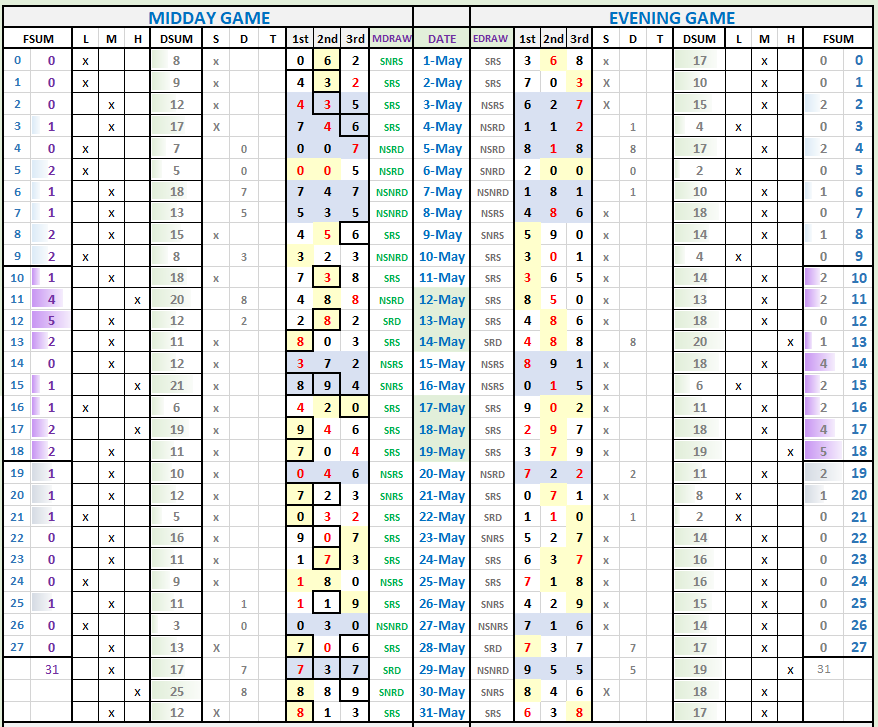
I designed this MSExcel worksheet to watch how Ohio's draw results are trending at a glance. As you can see from the image above, I can quickly see what
If you persistantly record and watch your States game in this side by side color coded sequencing manner you can get an instinctive sense for the trends in your States' games and increase your chances of a BOX HIT, or even a STRAIGHT.
For instance,
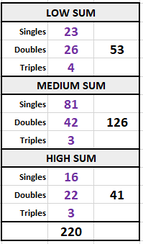
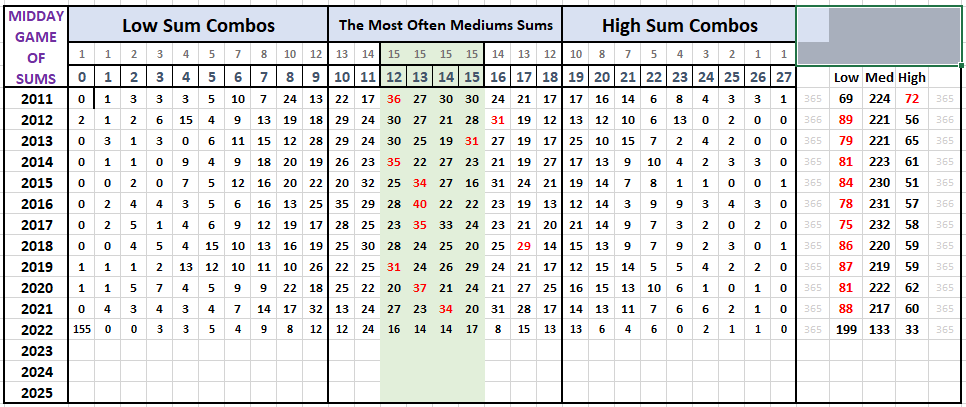
Watching your states draw results in a systematic manner as seen in my MSEXCEL worksheet above could very well help you get more BOX HITS. But no matter what state you play, Medium Sum Combinations are going to come out more. Why? because there is more of them. Combinations that Medium Sum to 12, 13, 14 and 15 are also more likely to come out. Why? because there is more of them. Let me give you some more facts about Ohio's Draw 3 Game that I've accounted for over a 12 year period. I believe it is something that is most likely true to games of other States as well. Ohio SumsBelow is a screen grab of my data counting SUMS for Ohio's Midday Game from 2011 thru to the Present (July 2022) organized by Low, Medium and High Sums. Leaning into the idea that the goal is to always narrow down the pool of combinations to play this data supports that by using the grid above for the 220 Unique Single and Double Number Combinations would be a good way to pick number combinations to play in the Pick 3 draw game. You can further reduce the combinations by watching numbers that are repeating into the next draw of the same game to either include them or rule them out.
More Observed Data on the Ohio Pick 3 Game
In the year 2021 there was a Monthly Average of
There was a monthly average of
This is good information for you to have as you watch your States game unfold over time and I've designed my MSEXCEL worksheet to calculate that for you. My MSEXCEL worksheet allows you to visually gage when the draw should flip to either a high some or a low sum, because the majority of the draws will be Mediums sum. Why? Again, because there is more of them. We've all grown to trust averages as the measure across the fields of our interest. From Bowling to Baseball. It's no different here with the Pick 3 game in Ohio. There are averages. And this data is most likely true in your State as well give or take a number one lower or higher. I watch Ohio, Pennyslvania, New York and New Jersey. And it seems to hold true for those States as well. The image below is my full scope looking at the Ohio Midday and Evening draw game when I'm ready to gamble. I can easily see the trends. Click on the image to enlarge it. Not only do I count SUMS; but I also can see how many times the numbers are drawn in each of the 3 positions, 1st, 2nd and 3rd; and I assign each draw a catagory. 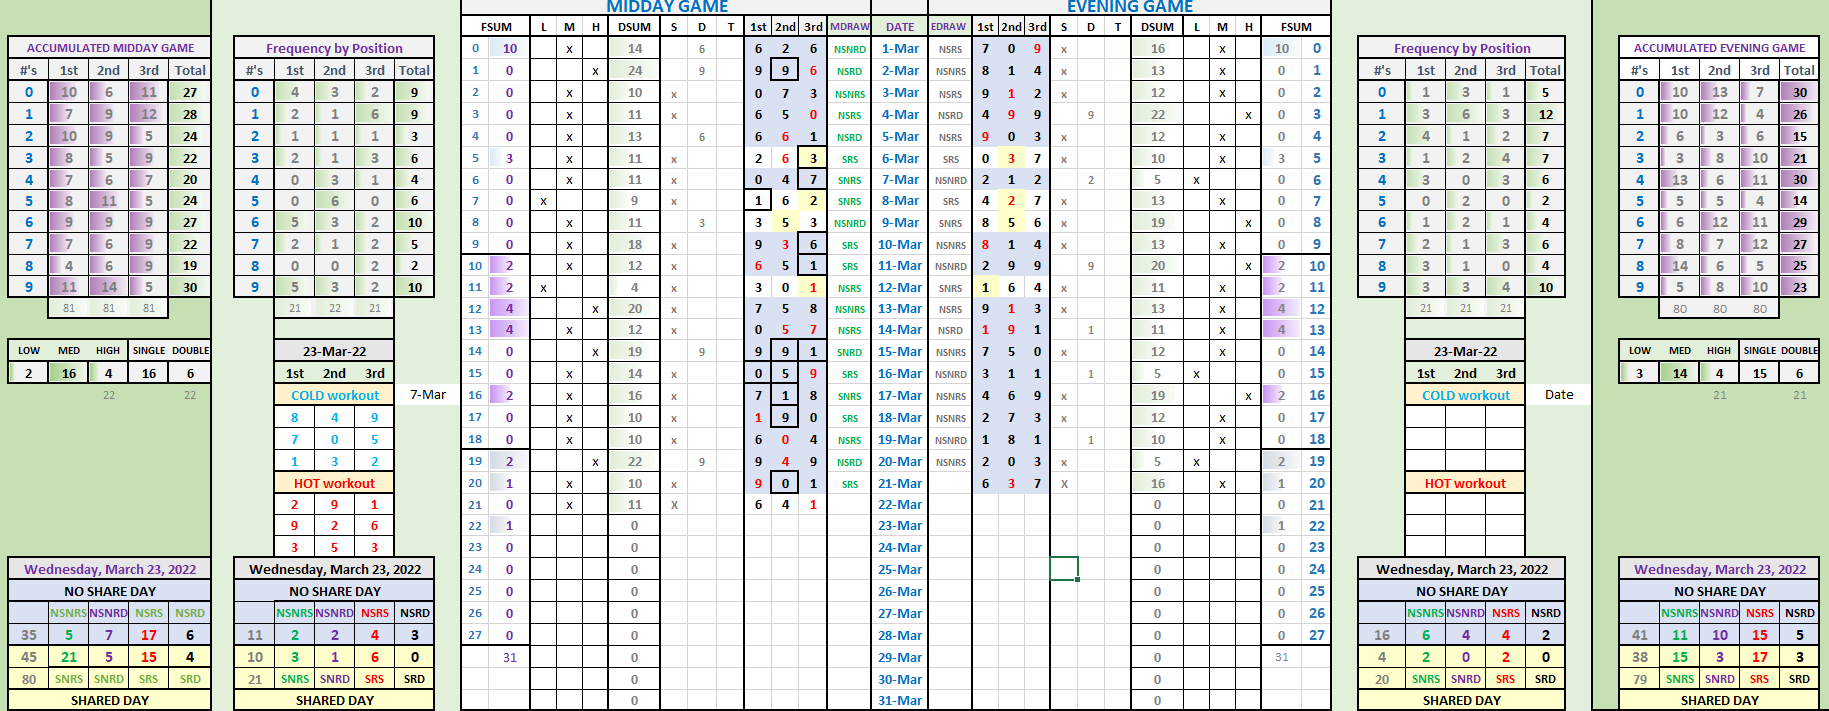
More about SHARED and NO SHARE DAYSThere are two catagories that can be assigned to the days play of games. NO SHARE or SHARED. Each of which can be further distinguished by whether they are a single or double combination, and if a number or numbers repeated from the same game prior. Each of these eight scenarios have their averages for how many time they happen over a months time. Below are the names of each catagory where each, NO SHARE and SHARED have 4 sub-catagories.
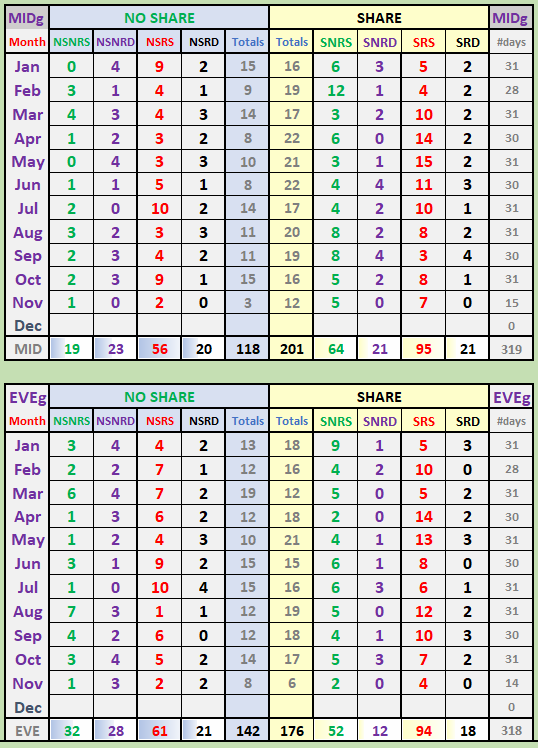
Look at the image above. This chart reflects the counts up to the present day 11/15 of 2022. This is the monthly count for each of the 4 sub-catagories in each SHARE and NO SHARE scenario reflecting Ohios' draw results for both the Midday game and the Evening Game. Look at the Totals.
For the Midday Game there was
This chart is showing us that there are always more SHARE REPEAT SINGLES and NO SHARE REPEAT SINGLES than any other scenario. These scenarios helps us to minimize our pool of numbers to make number combinations. My MSEXCEL worksheet helps me to see how these scenarios are trending and allowing me to wager on the flip. More Facts about the OHIO PICK 3 GAMEHere's another cool fact my Ohio Pick 3 data has shown.
Walking down to the corner store everyday with the same numbers to play, is not the way to play the Pick 3. You need the 3 W's and I don't mean the World Wide Web, but actually you could very easily get on the WWW to get your states results for the months and years past. I use LotteryPost and have Platinum membership, so I can use all its tools for negotiating my pool of numbers quickly. But its still not what I am referring. Here's what I mean by the 3 W's

I believe the key to being a successful gambler is to spend the least amount of money for the return on your investment. So in the Pick 3 Game I play the averages; And, I write down the draws, watch the trends and wait for the tides to turn, always keeping the knowledge of Ohio's averages in background of my decision making.
Am I always right in my wagers? No, of course not. The Pick 3 game is always going to be the Pick 3 game. Each digit has 1 in 10 chance of showing. Numbers are always going to be numbers---they behave well when we measure out a cake recipe, but on their own they behave like mischievous children--hiding, playing and laughing. Yes, Laughing. I know you've heard them laugh in the distance when you miss a drawing by one number. I don't win everyday, because I don't play everyday, and I have budget of what I can afford to lose playing. Its a source of amusement and entertainment for me, and not a desparate action for more money, and predicting serves as a mental challenge for me too. Predicting numbers for the games is challenging and satisfying when you get it right. Using my MSEXCEL WORKBOOK keeping track of the draws, I am able to easily able go back to a 90 day period to show HOT & COLD numbers by their position, and construct HOT & COLD numbers grids for making combinations that will balance off the numbers by position over the next 30 days. My backtesting for the states of Ohio, New York, New Jersey and Pennsylvania has shown that the numbers drawn for the 1st, 2nd and 3rd positions hit a balancing at 120 days; while 90 days shows whats out of balance. In addition, my MSEXCEL WORKBOOK, shows me the counts of Sums, and the counts of the catagories I assigned to each draw. It's my way of easily sighting trends and making note of the averages so that I may better wager on combinations. My MSEXCEL WORKBOOK will be available soon for purchase once my video tutorials are complete. 
|